Key Insights:
- XRP price is stalling near the $3 price level, and traders are watching for a breakout or reversal.
- ETH price is eyeing $3,400 after a bullish triangle breakout and strong momentum.
- XRP’s open interest has surged towards its January all-time highs, but Ethereum appears strongest from a technical perspective.
The battle between crypto’s largest altcoins, Ethereum and XRP, is again making headlines. While both assets show signs of strength, the XRP price warns investors to apply caution.
On the other hand, the ETH price looks poised for a decisive move toward $3,400. Traders are watching both charts as momentum builds across the market.
Bitcoin is stabilizing, and the general market sentiment is flipping bullish again. Could ETH and XRP soon decide who makes the next move higher?
XRP Price Hits Resistance Near $3
XRP price has recently bounced from a downward channel on the daily charts and shows short-term bullish signals. It crossed above the Ichimoku cloud on the hourly chart. It is a move that is often interpreted as a trend reversal.
However, on the daily chart, a “hanging man” candlestick has emerged on the 25 July candlestick. Historically, this pattern, with its long lower wick and small red body, is often a warning of a possible trend reversal.
Investors looking for a break above the $3 resistance should be cautious. XRP price may fail to turn the $3 price level into support. This could open it to a drop to $2.80. If this happens, the following support zones lie at $2.65 and $2.38.
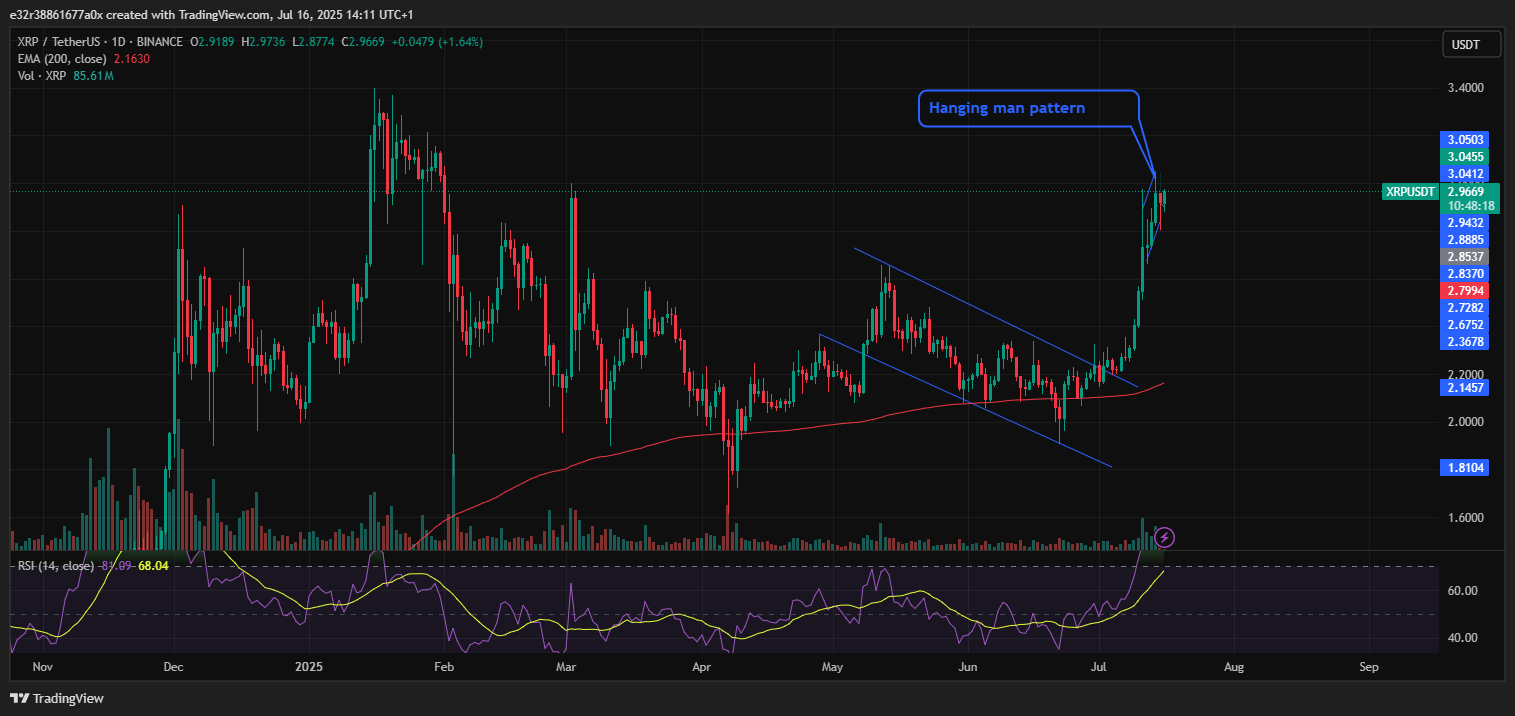
Despite these warning signs, traders are still hopeful. XRP’s open interest has surged to $8 billion. It has approached its all-time high of $8.33 billion from January.
Back then, a similar open interest surge pushed XRP to $3.20 before the subsequent crash in April. Bulls are hopeful that history could repeat itself. This optimism is taking place considering that the current price is only 23% away from its 2017 ATH of $3.84,
ETH Price Targets $3,400 After Triangle Breakout
While XRP hesitates, the ETH price appears much more confident. Ethereum is eyeing a breakout from a descending channel on the daily chart. It is an excellent indicator of strength.
So far, the price has cleared the 61.8% Fibonacci retracement from its previous downtrend. It is now aiming for $3,400.
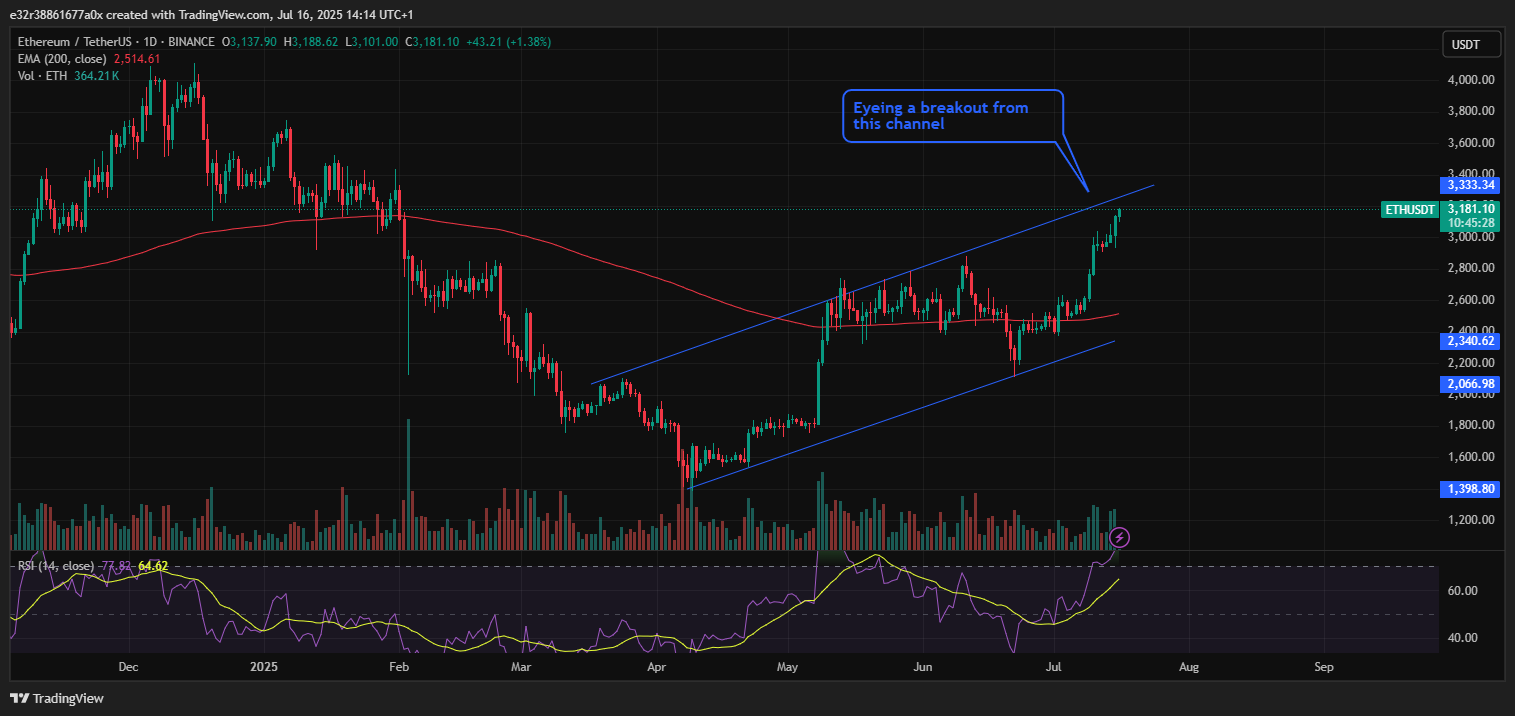
However, it is essential to note that the 14-day RSI is above 70, which indicates overbought but strong bullish conditions. In addition, both the 50-day and 100-day moving averages are sloping upward.
Even the ETH/BTC ratio is breaking out. This indicates that Ethereum may be the stronger candidate above XRP or Bitcoin itself. There are risks to be aware of, though.
If the ETH price loses momentum, it could crash towards the next support at around $2,933. Further support can be found at $2,739 and $2,600. However, for now, the momentum is clearly with the bulls.
Ethereum vs. XRP Price: Who Hits All-Time High First?
The race between XRP and ETH is getting more competitive. Both tokens are approaching essential levels, but their paths and momentum differ.
For starters, XRP price faces resistance of nearly $3. Also, its candlestick patterns show caution despite the rise in open interest. On the other hand, Ethereum shows strong technical signals with a breakout targeting $3,400.
It is worth mentioning that XRP price is closer to its ATH of $3.84 than ETH’s previous high of $4,878. Still, Ethereum’s current momentum shows it might have the edge over XRP.
Investors should watch the $3 mark for signs of a market recovery. If the bulls successfully turn this level into valid support and open interest continues to rise, a push upwards is possible.
ETH traders should monitor the $3,400 target and the $2,933 support level. A break above $3,400 could open the path toward $3,570 and even $4,000.
In summary, both assets are powerful. However, Ethereum has a more substantial technical advantage. Whether XRP can follow with a breakout will depend on volume and sentiment over the rest of the week.
Post Views: 7